Dashboards and their associated Charts can be viewed on the Business Intelligence Home Page, which can be accessed by selecting the Business Intelligence option on the Financials Web Main Menu:
Then the DSH Business Intelligence menu option:
The Business Intelligence Home Page will open - a Dashboard and its associated Charts will be displayed:
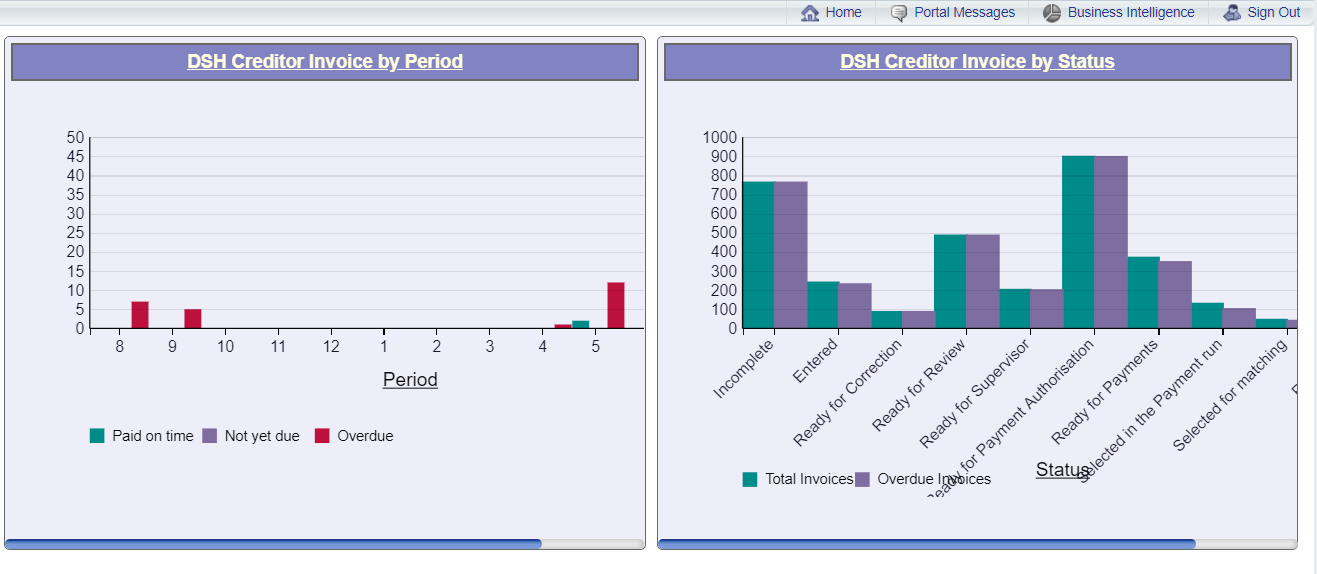
This will either be the Dashboard that has been allocated to your User or where one has not been allocated, the default Dashboard. Allocating Dashboards is further detailed in the Allocating Dashboards section.
Clicking on the title of a Chart on the Dashboard:
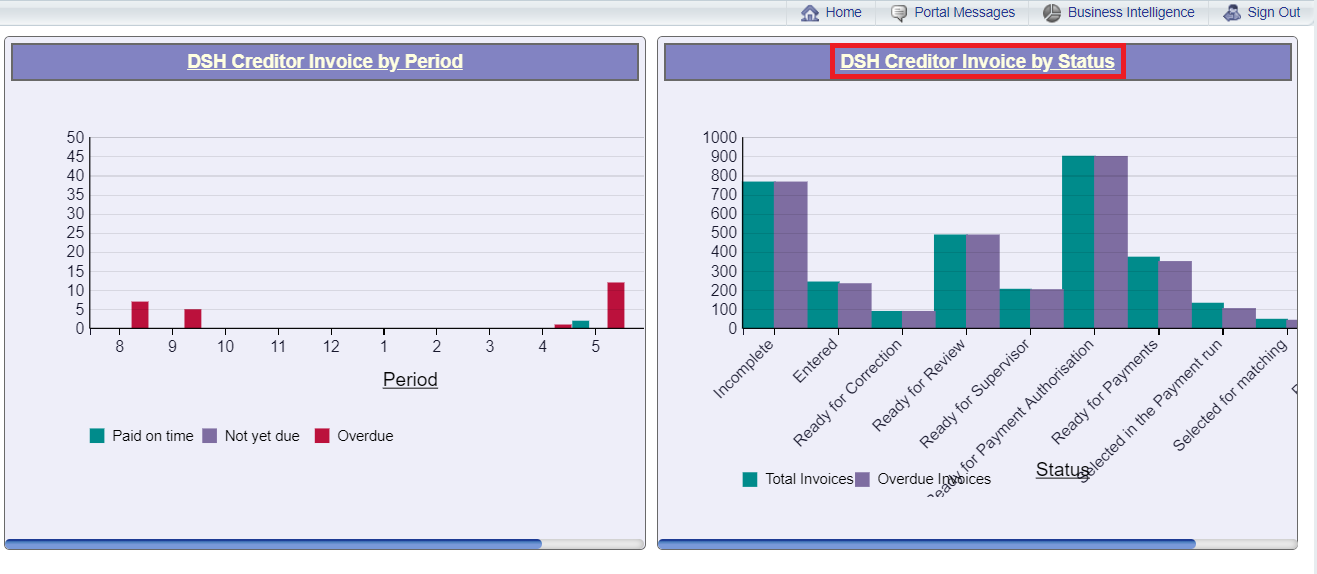
Will open the Chart in a separate browser tab:
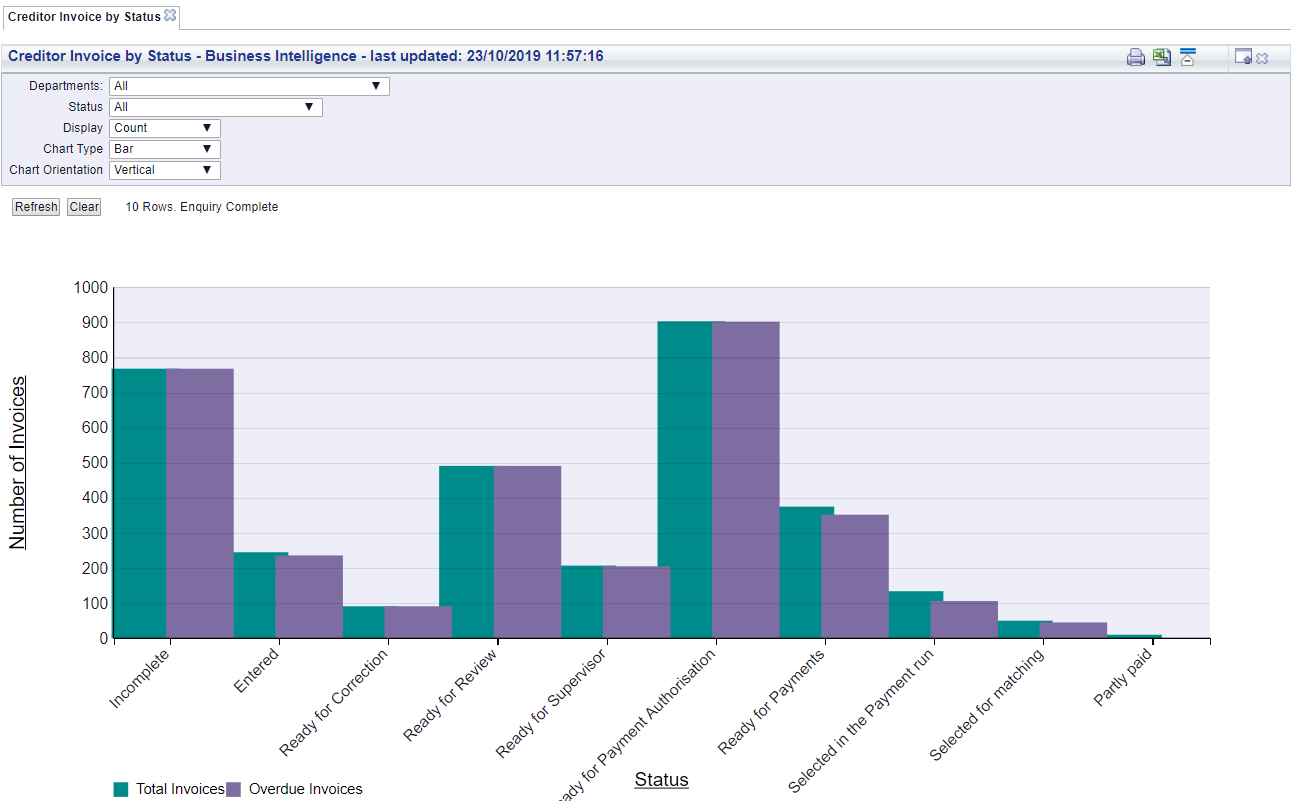
Filters are available at the top of the tab that control how the information on the Chart is displayed. Filters are further detailed in the Chart Filters section.
When the Chart is on a separate browser tab, clicking on certain areas in the Chart may provide more details as well a drill-down link to the relevant FinancialsLIVE enquiry facility, enabling any issues to be rectified immediately. Please note: this functionality is not available on all Charts.
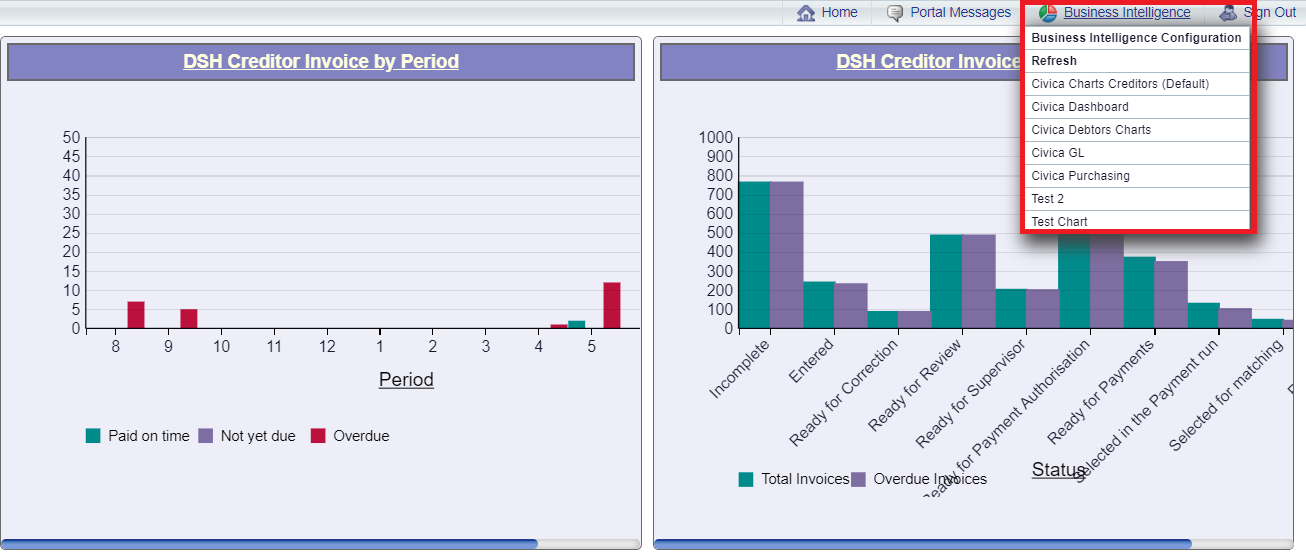
On the Business Intelligence Home Page clicking on the Business Intelligence option above the form will provide further menu options:
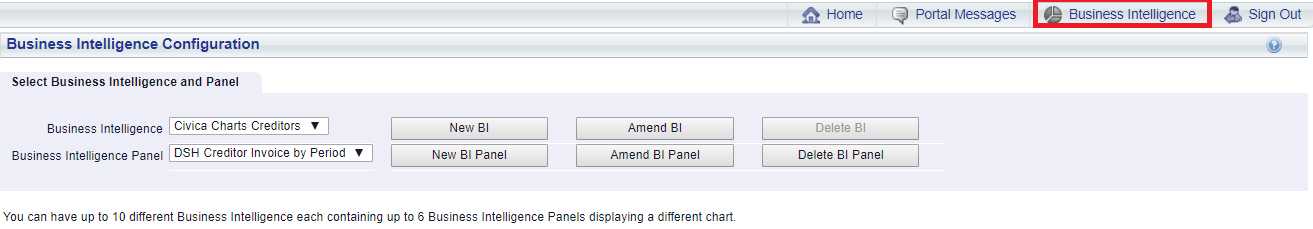
The first two options are:

The Business Intelligence field will display the Dashboard that was viewed on the Business Intelligence Home Page.
The Business Intelligence Panel field will display the first Chart that was displayed on the Dashboard on the Business Intelligence Home Page.
This form will allow you to make changes to this and other Dashboards, which is further detailed in the Amending Dashboards section, as well as to the Charts associated with each Dashboard, which is further detailed in the Amending Dashboard Charts section.
Clicking on the Business Intelligence link at the top of the form:
Will return you to the Business Intelligence Home Page and the relevant Dashboard and associated Charts will be displayed.
Please note: A SSIS package has been provided that generate the data required for Charts. The Charts will only be updated where the package has been run since the Dashboard was initially opened and there has been a change to the information on the Charts.
The remaining menu options will be other Dashboards that have been created. Clicking on one of these will open the Dashboard and associated Charts on the Business Intelligence Home Page.