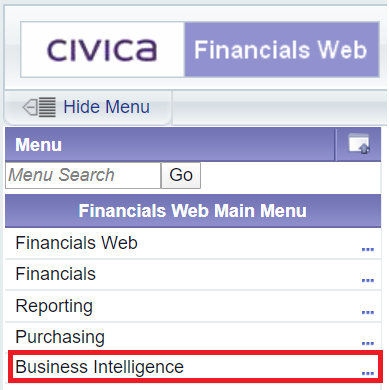
Charts can be added to a Dashboard via the Business Intelligence Configuration form, which can be accessed by selecting the Business Intelligence option on the Financials Web Main Menu:
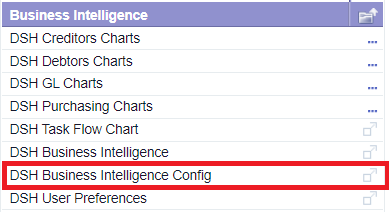
Then the DSH Business Intelligence Config menu option:
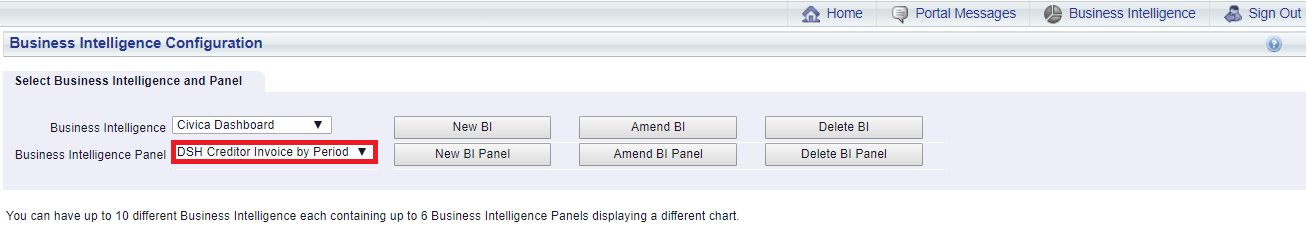
The Business Intelligence Configuration form will open displaying the Select Business Intelligence and Panel tab:
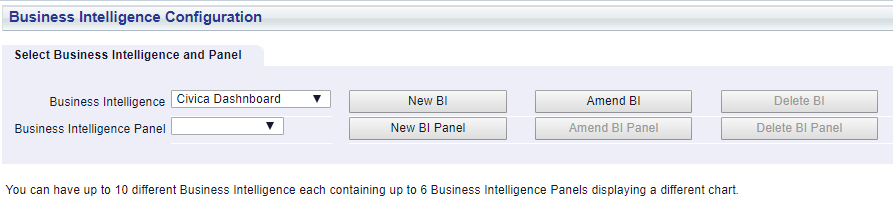
This tab will display the default Dashboard in the Business Intelligence field, .i.e. the Dashboard that will normally be displayed by default on the Business Intelligence Home Page.
Ensure that the required Dashboard is selected in this field - a different Dashboard can be selected from the drop-down list.
To add a Chart to the Dashboard click on the  button.
The Setup Business Intelligence Panel tab will open:
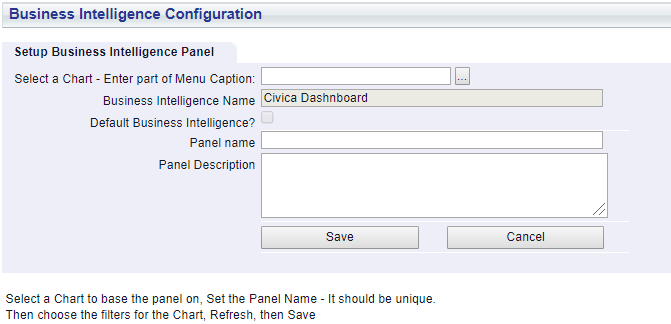
The following fields and options are displayed:
 , and a list of Charts will be displayed:
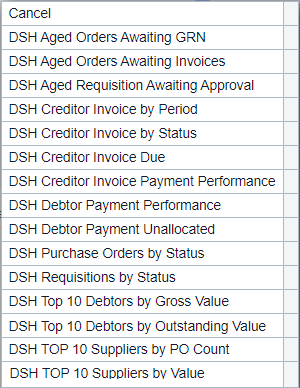
Select the required Chart and it will be displayed at the bottom of the form together with some filter options:
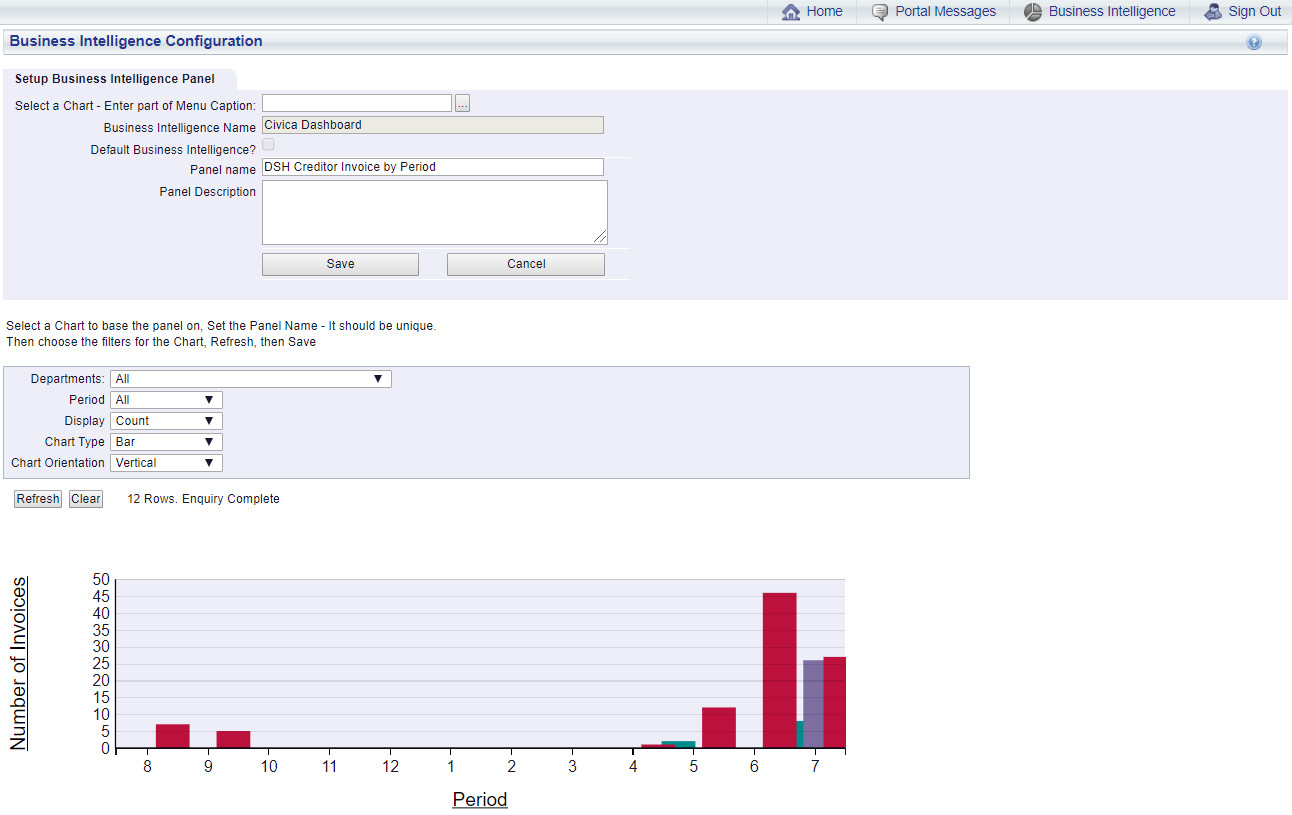
Clicking on certain areas in the Chart may provide more details as well a drill-down link to the relevant FinancialsLIVE enquiry facility, enabling any issues to be rectified immediately. Please note: this functionality is not available on all Charts.
Once the Chart has been selected in the Select a Chart - Enter part of the Menu Caption field, as detailed above, filter options will become available that controls how the information on the Chart is displayed:
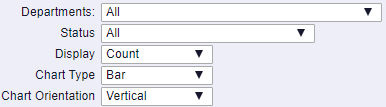
These are further detailed in the Chart Filters section.
The following buttons are available at the bottom of the Setup Business Intelligence Panel tab:
Further Charts can be added to the Dashboard by re-clicking on the button. Where more than one Chart is added, they will be included in the Business Intelligence Panel drop-down field. Please note: a maximum of 6 Charts can be added to a Dashboard.
Clicking on the Business Intelligence link above the form:
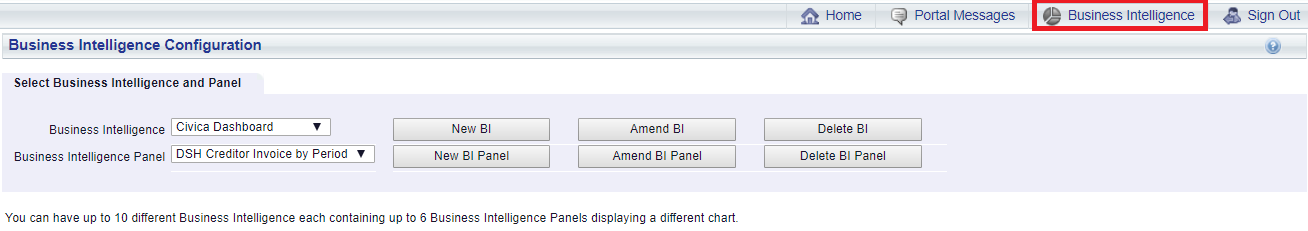
Will take you directly to the Business Intelligence Home Page where Dashboards can be viewed and which is further detailed in the Viewing Dashboards section.